Posts

Er worden posts getoond met het label Satellites

Delfi-C3 is feeling the power of Spring

Afbeelding
All the trees have blossom, baby ducklings are rooming the ponds, and we get more Sun: we survived the winter! Spring is here to give us our much needed vitamine D.  Spring on the campus of TU Delft Not only on the surface of the Earth this is felt, but also in outer space. The Delfi-C3, now more than 9 years orbiting our Earth, notices that spring has arrived on the Northern Hemisphere. During winter, our ground station (DopTrack) only receives data during the morning and mid day (between 8:00 and 13:00 CET). Starting from April, we start receiving signal around 20:00 CET. Fraction of a 24 hour day (UTC) at Time of Closest Approach (TCA) of the Delfi-C3 with DopTrack. We saw this already last year, when in April the telemetry of Delfi-C3 started appearing in the evening. The Sun was already set on the ground, but at 560 km height light was still shinning on the solar cells of the satellite. The satellite is designed such that when sunlight hits the solar cells and eno...

PhD almost over, so lets write a little about it

Afbeelding
The ice sheets and glaciers on our Earth are currently melting, which causes the global sea level to rise. This has of course major impacts on the 44 percent of the world’s population living in coastal areas. This melting is happening already since 24,000 years ago, during that time enormous ice sheets, up to 3-4 km thick, covered lands like Scandinavia and Canada. Scientists have done measurements of this rising sea level using the coral reefs at Barbados that show a sea level rise of 120-130 meters since the start of the de-glaciation. Imagine this for a moment; England was not an island at that time. Currently, we see a global sea-level rise of 3 mm/year, however locally the rate of sea-level change can vary significantly. For example, at the coastlines of the Netherlands we observe a 2.3 mm/yr sea-level rise, whereas the center of Sweden and Finland has a 7.8 mm/yr sea-level drop. The cause of these particular variations is that not only the sea-level changes, but also the so...

DIY satellite-pass planner

Afbeelding
The new lecture year is coming and the satellite communications and tracking practicum is about to start. In this lecture, students have to plan a satellite pass, record the downlink signal, and post-process this data, such that they can recover some parameters like: Time of Closest Approach (TCA), carrier frequency of the satellite, and error estimates compared to TLE (see previous blog posts: here , here , and here ). For the first part, the students need to compute when the satellite is flying overhead. There are many websites and apps that are able to give you 5 day predictions, but I wanted to see if I could do this myself. As a little boy I always had the tendency to say: 'I can do that too!'. Up until the time my father said: 'Son, you can only say "I can do that too", when you at least have done it ones.' So, living by that wisdom I want to show you how to build your own satellite-pass predictor. To validate my efforts, I am going to generate the ...

Measuring mass changes with satellites

Afbeelding
In my latest paper, GRACE gravity observations constrain Weichselian ice thickness in the Barents Sea , I use an incredible satellite data set. Starting from 2003, NASA's GRACE satellite mission is producing monthly "images" of the Earth's gravity field. These observations are so accurate that certain mass transport is visible, if you look at the differences between these "images". This new data set gives tons of information about many different natural processes. Oh and the figures are so cool! For this blog, I downloaded GRACE data (click here for information, and here for the data) from the period between 2003 and 2013, CSR release. For every spot on the Earth, I calculated the linear gravity change in this period, so not the seasonal variations. The results are shown in the figure below: GRACE gravity change during 2003 and 2013 using a 'white' noise filter of ±0.5 microGal/year. The red areas show localised gravity increase (or ma...

Delfi-C3 still working after almost 7 years!

Afbeelding
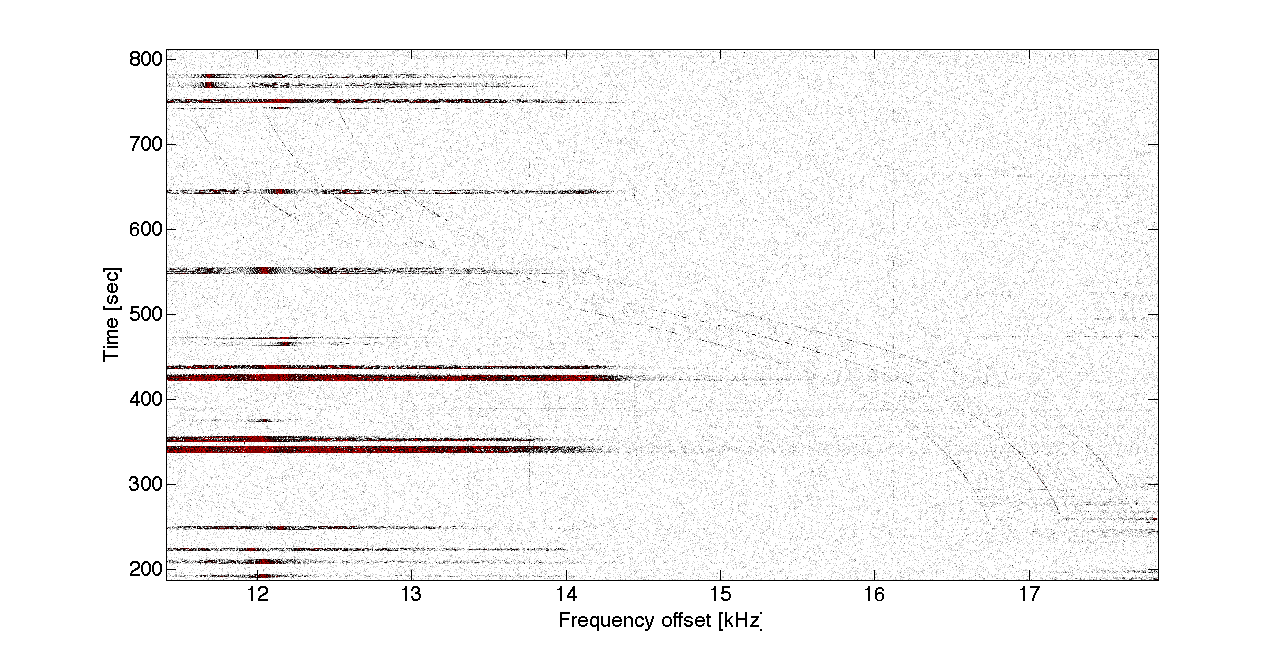
Did you hear about the story of a small satellite designed and build by students of Delft University of Technology? I mean a real satellite in SPACE!!! It is still flying and transmitting data back to Earth and you can listen to it! Some of my nerdy friends have complained that I cannot listen to the sound of satellites as I various times state on this blog (e.g. post , post , and post ). Something to do that sound does not propagate in vacuum, and space is almost vacuum. So, yes satellites do not make sound (20-20000 Hz for the human ear), however in my defence you can transform their radio signal (145.870 MHz) into sound. Its the same trick scientists do when they listen to the SOUND the universe makes (listen to it here !). But, lets get back on topic! Delfi-C3 is still operating and in honour of its almost 7 years in space, I wanted to write a small piece about it. To see if it is still operating, I have recorded the downlink signal of today's passes. After a Fourier t...

The start of construction of the TUDelft satellite tracking station: DopTrack

Afbeelding
Monday 20 October 2014, we started the construction of DopTrack, a satellite tracking station on top of the tallest faculty of Delft University of Technology for students to use in satellite orbit determination. I will try to report on our findings of building it in this blogpost. We are in the process of setting up a dedicated website, but for now you have to do my blog ;) Project DopTrack As a master student, I followed several courses on orbit determination and satellite data analyses in the Astrodynamics & Space Missions group. During this time, I also observed the design and launch of two cube-sats of the space system engineering group. I was inspired by what students and university staff could accomplish. Come on, they launched two satellites in space. SPACE!!! However, after launch and succes of the missions the satellites were left alone. It would be cool to combine the use of these satellites and the knowledge from satellite data analyses courses. So I decided, when...

Listening to the sound of satellites

Afbeelding
Last week, components of the TUDelft satellite tracking station were delivered. This includes a radio, amplifiers, Software Defined Radio (SDR), a GPS-based clock and other cool electronics. We are now planning the integration of all the components in the existing ground station, which is used for the data downlink and command uplink of the Delfi-C3 and Delfi-n3Xt (both student designed and built satellites currently orbiting Earth). But how does this tracking (you speak of) works? It starts with capturing and recording the communications signal of the satellite, which is transmitted continuously (if the Sun shines on the solar cells to produce energy). This is where all the fancy and complicated electronics play a role. (However, I am not an expert in this, so I will only explain the physics behind it). The high frequency (145.870 MHz) electromagnetic signal is down-converted to a signal that can be made digital, such that a computer can process it. First we put the signal throug...

TUDelft students are awesome!

Afbeelding
A few weeks ago the second TUDelft satellite (Delfi-n3Xt) was successfully launched into an orbit around Earth. In space, yes! This satellite was designed and built by students of my university. However, their other 5-year-old satellite (Delfi-C3) is still flying and communicating its data towards Earth. A student, a colleague and I are using this old satellite to test our idea for a new satellite-orbit determination-project. I always like to call it: "Listening to the sound of satellites" (see previous posts).  During the launch event I was thinking that it would be cool to capture both satellites' transmission in one observation using the VHF antennas. So I ask the ground station operator (the student), if this was possible. After a few days he send me this figure: He found a day that both satellites were visible from the TUDelft ground station. The red line is the orbit track of the Delfi-n3Xt (new one). The green cross is the location of the TUDelft ground...

Delfi-n3Xt baby sounds...

Afbeelding
This morning I got up earlier today to attend the Delfi-n3Xt launch event in our faculty. Delfi-n3Xt is a nano-satellite (the size of a milk carton) which is built by students and staff of our faculty. Launch events are always exciting, because you don't know what will happen. But after two stressful hours we got the confirmation, "Nano-sat number 7 successfully deployed." This was followed by some cheerful cheers. However, was it turned on? This blog started with some post about listening to satellites using the ground station on top of EWI (faculty of electronic engineering, mathematics and computer sciences). This ground station is mostly set up by a student which I assist in teaching him to track satellites. So this gives me the opportunity to get the telemetry data of the Delfi-n3Xt quite fast. It's good to be a teacher :). The next figure will show the satellite's first sounds in space: Click on the figure to get a larger view. In the bottom left...

Melting of the ice, backwards

Afbeelding
A few days ago, two workmen were fixing my sewer and plumbing system underneath my house (It was kinda smelly). During the coffee break (which is the theme in my blog, all good things come from a coffee break), I had to explain what I did at the university. So I explained that I was looking at the motion of the Earth's crust due to ice loading during the late-Pleistocene ice age (well not in those words, and I did not mention, that I was doing this with satellite data, because my experience tells me to leave this part out. If you use the word satellites, people just stop listening and laugh). They found it very interesting ;). I know, it is an abstract subject and difficult to grasp (it took me several months to fully understand the complexity of the problem, I am still working on how to solve it). Last week I needed to look at the ice sheet, that caused the motion of the crust that we observe today. People have made models on the growing and melting of this ice sheet, us...

My first 'real' scientific report: Rossby wave observations in the Atlantic Ocean

Afbeelding
My background is not entirely scientific (maybe that is a good thing, I don't know). I've done my bachelor and masters at the faculty of Aerospace Engineering of TUDelft, which is a Technical University. The biggest part of the education is focused on engineering problems, team work and just building cool stuff. Which is great, but completely different from scientific research (we could debate this, but that is for another blog post (email me ;))). So what decided me to dedicate my life (well for now, I can't look in the future) to science. In our last year of bachelor, we have an end project called the Design Synthesis Exercise. Ten students, ten weeks, locked up in very small room, creating, designing and engineering. Our assignment was to design a mission to Ganymede to find evidence for a sub-surface ocean. Cooooool!!! After a lot of work and fun, we came up with the Marius Space mission (Simon Marius (No not Galileo) was the second man (yes the first one was Galileo)...