My first estimates of the gravity field of the Rosetta comet, 67P/Churyumov-Gerasimenko
Last week, I saw a very incredible photo compilation. The Rosetta ESA satellite is currently orbiting a comet in outer space. Onboard is a camera, that is constantly taking pictures of the object. On thursday 2 October, the ESA Rosetta blog showed active geysers, shooting water of the comet out into space. What we learned as a kid, we can now see with our own eyes (well via the camera lens, a high-data space downlink, and a remarkable team in the ESA Operations & Science). Active geysers on a COMET!!!!!! Amazing.
After re-finding myself from being blown away by amazement, I continued browsing this blog. There, I found that they had build a 3D model of the comet and you (as an internet user) could download it to built your own comet. Totally awesome, unfortunately, I do not have a 3D printer. Nevertheless, I downloaded the files from the blogpost (see here). You can download .wrl and .obj files. Clicking on the .obj file, opened the comet in Adobe Photoshop. Look at that, I could rotate and play with my own comet:
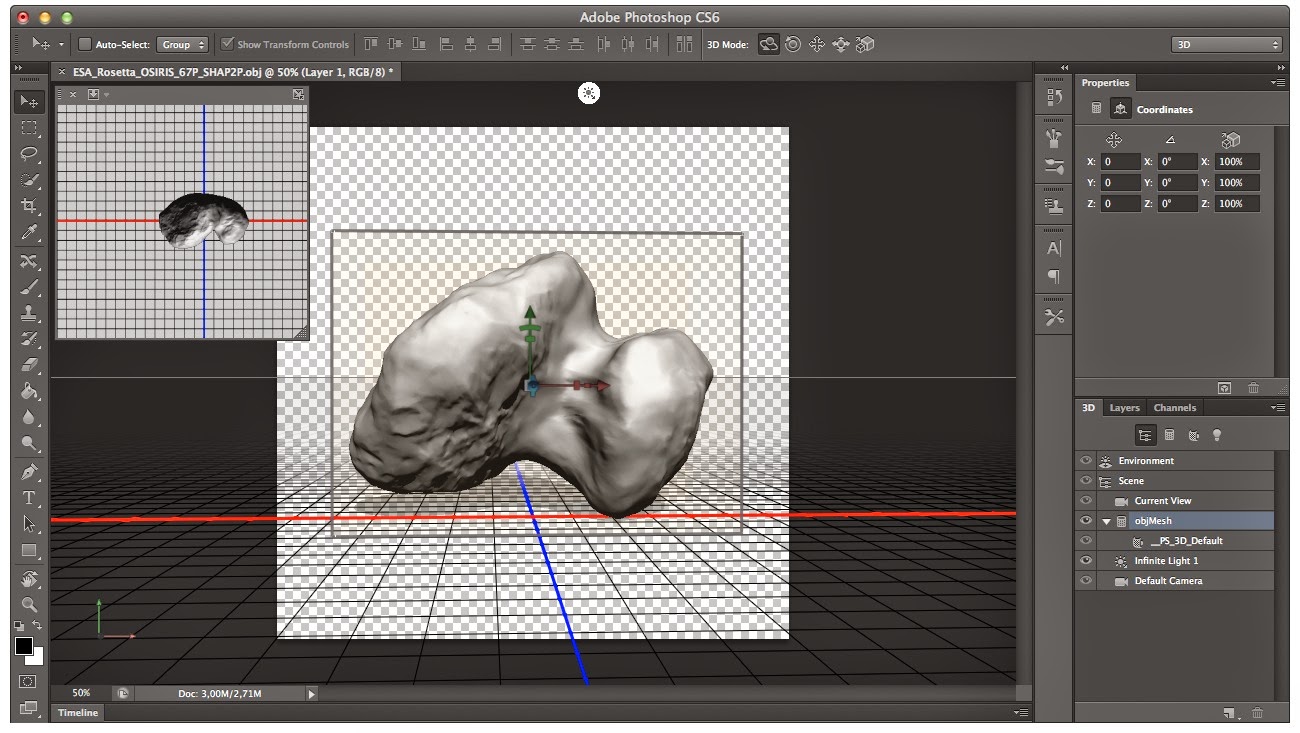 |
| This is what you see when opening the .obj file |
After rotating the comet for several minutes, my nerdy brain started to pinch me: "Dude, if we had the coordinates of the surface, we could do some awesome stuff!". So I looked at the .wrl file with TextEdit (or Notepad) and found the following code.
#VRML V2.0 utf8
# Generated by VCGLIB, (C)Copyright 1999-2001 VCG, IEI-CNR
NavigationInfo {
type [ "EXAMINE", "ANY" ]
}
Transform {
scale 1 1 1
translation 0 0 0
children
[
Shape
{
geometry IndexedFaceSet
{
creaseAngle .5
solid FALSE
coord Coordinate
{
point
[
-0.393756 0.401856 0.442509, -0.163294 0.491935 -0.000659, -0.515386 -0.259898 -0.343331, -0.277434 -0.260428 0.279815,
-0.55193 0.159748 0.155219, 0.091377 -0.282348 -0.211614, -0.792302 -0.192477 -0.092299, 0.785257 0.323246 -0.017733,
-0.093053 0.512756 -0.20542, 0.83051 0.3069 -0.045469, 0.795553 0.336202 0.063932, 0.168434 0.640004 -0.350024,
0.241654 -0.381833 0.019116, 0.200554 -0.206936 -0.422803, -0.215483 -0.128884 0.356076, -0.41427 -0.434269 -0.193254,
-0.687416 -0.006455 0.036488, 0.920413 0.222731 0.137458, -0.511265 -0.217672 -0.356012, 0.835122 0.2753 -0.114706,
0.724787 -0.241446 -0.305928, -0.574952 0.063756 -0.033269, 0.509054 -0.535483 -0.079728, -0.070761 0.50456 0.425794, ...
After the line "point" , a lot of numbers were printed, sets of three numbers separated by comma. These must be coordinates (x, y, z). They were normalised because the value of the numbers were between -1 and 1. So, I wrote a little code to separate these numbers and obtain three vectors, with the x, y, and z coordinates. To check if these were the surface-data points, I made a scatter plot.
 |
| The point cloud of the comet |
Yes!!! I had obtained a data set of the surface of the Rosetta Comet (I call it the Rosetta comet, because its real name is very long (see title)). Now we could do some cool stuff. In previous blogposts, it might have become clear that I am a gravity scientist. My job is to look at objects (usually planets) and say something about their gravity field. In the beginning of my PhD research I had written software that is able to transform geometries + densities into gravity potential fields. I wanted to see if my software was able to generate a Rosetta comet gravity field. I already had the geometry of the object and an estimate of the density could be found on the ESA blog (do not use the English wikipedia page, because they think it is made out of material that is more than twice as light as water [400 kg/m^3], or they made a typo!), 4000 kg/m^3, which is typical for a stoney/ice comet.
However, when I continued I run into a few problems. The .wrl file was normalised, so I needed to find a scale factor. On the blog I found a volume (25 km^3) that was given and using that value, I found that the scale value must be around 2500 m. Another issue was related to my software, which made me reorientate the origin of the comet (its one of those boring details, but if you really want to know, make a comment to this post). I translated the origin with the following values:
x = x - 0.2;
z = z + 0.25;
These modifications are a bit "sticky finger" work, but in the small time I had, I could not find better values and I really wanted to write this blog (maybe if I have some more time, or information). But now my software was able to make a gravity field model, assuming that the comet had a homogenous density distribution, which is not the case, but a good first estimate. Hopefully, after 12 November more information about that will be available (They are going to land a robot on the comet!!!!). Putting the geometry and density in my software, enabled me to make a model of the gravitational attraction of the comet.
 |
| The gravitational attraction in the radial direction at an altitude of 500 m above the highest point of the comet (in my reference frame), which is located around -120 degree longitude and +40 degree latitude. |
I calculated the radial attraction (mGal is 1/100000 m/s^2, so very small) at 500 meters altitude above the comets highest point (in my reference frame). On Earth the radial gravity is dominant and doesn't vary that much, because of its spheroid shape, but here you even got negative radial gravity field, which is quite fascinating, or I am doing something wrong. Doubting my quick computing skills, I also plotted the magnitude of the total gravity vector.
 |
| Magnitude of the gravity vector felt at 500 m altitude. |
Luckily there was no negative gravity, but in the southern area of the comet the gravity was quite low. At close distance the gravity field of a comet fluctuates very rapidly. You have to stop thinking in Earth or planet terms. To fly a satellite in this kind of environment is very tricky. I wish the Operations team at ESA a lot of success and hopefully they have a better representation of the gravity field (in a better reference frame) than I have.


Reacties
Een reactie posten