Last week, I read in the papers that the Danish part of the Waddenzee is also put on the World Heritage List. This means that the complete Waddenzee (Dutch, German and Danish) is a protected nature site. Me, as a strong admirer of this region, makes this news happy and content! It also gave me new inspiration for a blogpost. In this blogpost I will look at an experiment that I did on the Waddenzee. At the end I will prove that the Earth is round (or more precisely, not flat).
The Waddensea is an area north of Holland, north-west of Germany and west of Denmark. when inspecting any atlas or google Earth, you can spot a row of islands from west to north-east. In between these islands and the mainland is the Waddensea, with all its beauty!
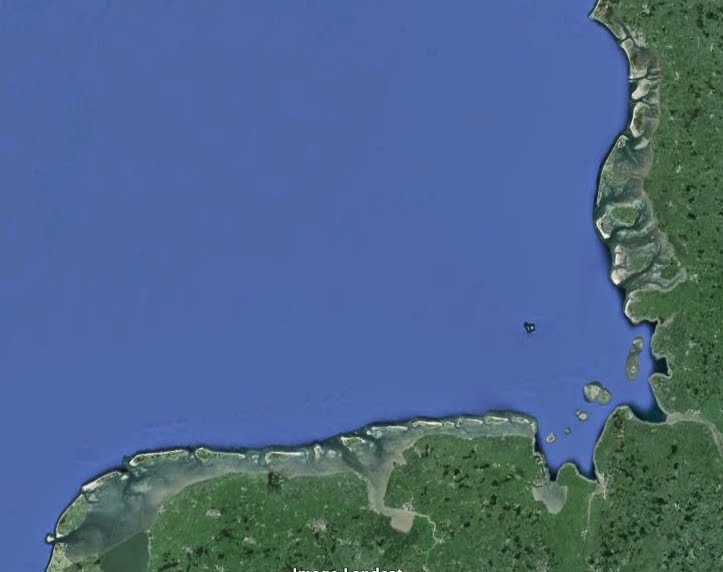 |
| The Waddensea is the area between the mainland and the small islands. The Dutch, German and Danish part can be seen. |
Special about this region is the large influence of Earth's tides on the landscape and nature, the Waddensea is a very shallow sea. At high tide, the area is completely covered with water, but at low tide, large parts of the area become dry. This creates a very special eco-system thriving with life, see
Wiki (The English page is quite short, but if you can read Dutch go to that page for more information). I know the Waddensea mostly onboard a "platbodem", or flat-bottom sailing boat. This is the best way of visiting this area and really get to experience the nature, people and water. Speciality of this ship is that at low-tide it can rest on the ocean floor, without tipping over. You just have to wait 6 hours, before continuing your journey.
 |
| We made the trip with the platbodem "de Overwinning". |
Onboard one of these voyages I did my first GPS and navigation experiments. I just got my Garmin GPS receiver and I wanted to play with it. So, during a trip between two islands (from Ameland to Vlieland) I turned on the Garmin receiver and recorded the data. It was quite a nice trip, because at the end the wind started to increase and the captain put out all his sails to maximise the speed. We will see this later in the data. The track we sailed is shown in the next figure:
During this voyage, I challenged the "schipper" (captain) to go as fast as possible, because he was all the time bragging about the speed of his vessel. So, he put on all the sails he got and we flew over the water. I experienced this at the front of the ship, where I was responsible for the Fok. The speed and excitement is felt best at this location. The GPS receiver was turned on and recorded the whole trip, also the velocity of the ship.
 |
| Recorded velocity of the ship |
As you can see, our averaged velocity was 6 knots, but at a certain point we touched the 11 knots (set-up of the many sails). We couldn't maintain this velocity, because our destination port was close. However, the trip was a good test-run for my GPS receiver. That night, enjoying a proper "schippersbitter" (sailing booze), I post-processed the data. One of my goals was to see how accurate the velocity was that was given by the GPS receiver. To find out, I used the more frequent position measurements, which I numerically differentiated. As we have learned in high school and again on university, the derivative of position/path/length/voyage is velocity. This is what I obtained:
 |
| First try at computing the velocity of the ship. Blue line is the recorded velocity. Red line is the computed velocity. |
What was this about? My computed velocity was much higher then the GPS receiver presented. What did I do wrong? Because of a storm, we could not sail out. We had to stay in the harbour, which gave me time to explore the island (Vlieland, the second island from the west, see figure 1 and 3) and to clear my head. While enjoying the scenery of violent waves and stormy weather, I found my bug/error/stupidity. After getting back to the ship, grabbing a hot coffee to heat up, I jumped behind my computer and changed my code. "The Earth is round!", I stated. "Yes", said the captain, "it will be like that for some years, they say!".
I miscalculated the length of our voyage by using math for a flat Earth. I told my software that latitude was y and longitude was x, before calculating the length between two points by the following equation:
s = sqrt{(x2-x1)^2 + (y2-y1)^2}]
Which is correct on a flat surface, but not on the round Earth. Luckily, I was following a course on spherical geometry, which enabled me to calculate the distance between two points on a spherical surface.
s = 111.317*rad2deg(acos(cos(lat(2))*cos(lat(1)) + sin(lat(2))*sin(lat(1))*cos(lon(2)-lon(1))))
(Its less complicated than it looks). Inserting this relation in my code, for the previous one would give me the correct result.
 |
| The correct computed velocity in red overlies the recorded velocity in blue. |
You can clearly see that the computed velocity has a higher time resolution, due to the high resolution in position recordings. Nevertheless, I found that the presented velocity of the Garmin receiver was as accurate as the position estimates. But more important, I rediscovered that the Earth is round and will be for many years to come (because, a "schipper" never lies).


Reacties
Een reactie posten